Denials Aren't Your Main Problem
Bold Claims is for folks who want to make more money practicing medicine. Written weekly by Atlas CEO David Freed. If you don't profit from reading, he didn't do his job.
I’m not saying denials aren’t important. They can drive a practice out of business. They’re the first line of billing problems. I’ve had the pleasure of working with dozens of practices, and everyone has a different set of denials. Pre-auth. Eligibility. Coding. But focusing on denials is the definition of tackling the urgent problems, not the important ones.
Last week, we talked about the Holy Grail of practice management metrics: revenue per visit. When you book a patient for a meeting, how much money comes in? Focus on this, and you capture every bit of the revenue cycle.
When we did that, we talked about all the ways that money can leak out of your practice. There was a simple equation involved.
Revenue Per Visit = Contracted Rate * (1 - cancel rate) * (1 - denial rate)
This equation is simple, but powerful. Take it seriously, and you can see meaningful changes in your practice. Unfortunately, for most practices the approach is to spend 90% of the time on the last variable: denial rate. Sadly, fixing the denial rate creates only 10% of the value. Where the real value comes from is the first part: the contracted rate.
Think of it this way. What % of your practice’s revenue is stuck in denials? Our experience is that most clients have 10-15% of what they’ll eventually collect tied up in A/R. So by working on denials, you can increase your take-home revenue by a maximum of 15%. That’s meaningful. You gotta do it.
But there’s a lot more to be found by figuring out your rates. What was the last time you looked at all your insurer rates, side by side? We do this analysis for every new client. Let me show you an (anonymized) one we did recently. This represents their average payment per client visit across their 11 major payers.
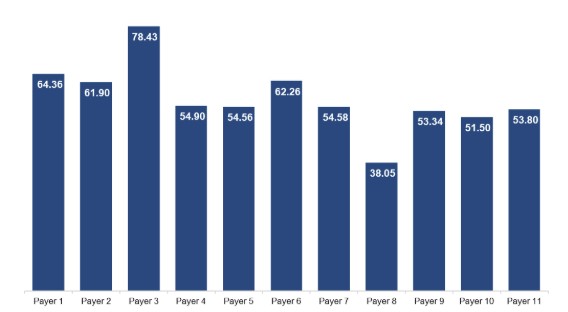
This is not unique. We do this graph for every practice, and I'd estimate the average practice has a 45% price difference between their highest- and lowest-paying payers.
A couple of these lines … do not look like the others. Imagine that you’re this practice. You have two options:
The first is spending your time chasing and fixing denials. That’s worth about $6-8 per visit.
The second is focusing on getting more patients from your higher-paying payers. Every time you take a client from Payer 3 instead of Payer 4, you are grabbing $24. That’s four times the value of your denials. You can do this in two ways:
- Changing the insurances you take. Imagine continuing to take Payer 8 after seeing this graph.
- Renegotiating rates. When our client saw this, they realized they were losing money on Payer 8, and immediately sent them a renegotiation request with the graph in it. They did a similar tactic for Payers 4, 5, and 7 to get them to $65 / visit.
Maybe your neighborhood MBA will roll their eyes at this. “It’s the price, stupid”. Mr. MBA is right… but 90% of practices we work with have never put this on the screen before.
The practice manager may roll their eyes at this. “Easy to say, harder to change.” I agree. Negotiation with insurance companies is difficult. But (1) it’s not impossible - more to come in future newsletters - and (2) it’s worth 2-3 times what you’re getting from solving your denials. Are you investing that way?
Start this week by figuring out what your insurances are paying you per visit. Compare that to your costs. Do the simple math. Are all your insurances worth taking? Which ones do you need to talk to about those rates?
P.S. Might be worth thinking about this next time you’re credentialing with new insurers.
Small steps. Long time horizons. Big results.
If I or my team can be of service, feel free to grab time.
Onwards and upwards,
David