The One Billing Metric You Should Care About
Bold Claims is for folks who want to make more money practicing medicine. Written weekly by Atlas CEO David Freed. If you don't profit from reading, he didn't do his job.
When I ran an online high school, measuring performance was the hardest part of the job. Any teacher will tell you learning isn’t measured by numbers. Grades help, but often represent how a student prepares for a test, not material mastery. If students know a test is coming, they prepare. This is called Goodhart’s Law: when a number usually used to measure something (student learning) becomes the target, it ceases to be meaningful.
The most famous example of this is from colonial-era India. The cities were overrun with a snake infestation. The British had a simple solution: put a bounty on the snakes. The response they wanted: let’s kill all the snakes to collect the money. The response they got? Locals started to breed the snakes outside city limits so that there were more opportunities to kill and collect cash. Smart!
The lesson some people take from Goodhardt’s law is that numbers don’t matter. Everything can be gamed, why care? The better lesson is you need to focus on fewer numbers that measure exactly what you care about.
Easy to say, hard to do. How do you apply this to your practice? What numbers should you care about?
For today, let’s limit our focus to the billing side of the house. The cost side is generally simpler: unless you’re spending on good people / technology, less is more. But the revenue side of your business is harder to measure.
We’ll soon talk about what other numbers you should ignore but let’s not bury the lead: the Holy Grail number is the revenue you get from every visit. You should see this number every month. Your biller should give it to you at the top of their report card.
Revenue per visit (‘RPV’, to save my fingers) has two things going for it. First, it is deliberately simple. Simple numbers are far harder to cheat. When you put a patient in your office, how much are you going to get back for that time?
Second, RPV is comprehensive. Let’s look at it as a slightly longer formula.
RPV = (Contracted Rates * Services Billed) * (1 - Denial Rate)
RPV captures everything that drives your practice’s revenue!
- All of your billing work is captured in the “denial rate” (if you are owed $100, what do you, on average, get back from insurance)
- Your coding work is captured in what services you bill per visit – are you thinking about E&M correctly? Do you sequence the higher-value codes to take advantage of MPPR? Are you including all the care that you could?
- It captures the rates you negotiate with insurance, arguably the most important part
The sad truth is that most billing metrics / billing managers are 100% focused on the last part - denial rate. But most of those numbers are vulnerable to easy manipulation.
Atlas is proudly the only firm we know of to advertise the impact on RPV.
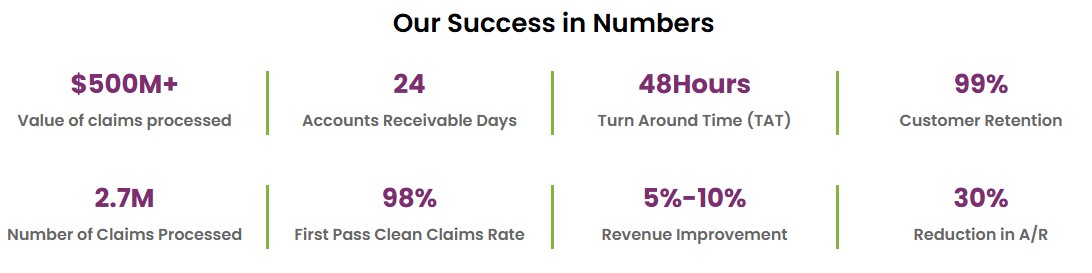
Here’s the report card a big national biller uses for advertising. A few common industry numbers are on here. When I first started Atlas, I used versions of these to manage my teams. So when I tell you why it didn’t work… well, it’s from first-hand experience.
The first billers I had focused on A/R. I told them they’d be promoted or fired based on A/R balances. And at first, very quickly, A/R went down. But when I dug into it, I saw why - with their jobs on the line, the best option to reduce A/R was to write it off. They were not going overboard or acting maliciously: they were following incentives. If it’s going to be too hard to get, let it go.
Clean Claims Rate is pretty intuitive - no denials, all good. But when I gave it to my coders, they became much more conservative. When all that matters is getting approved, why add extra codes? Another metric I often hear about - Net Collection Rate - has similar problems. The easy way to increase net collection rate? Code fewer services.
But just because they are focused on the denials doesn’t mean you should be.
Imagine this: if I told you RPV improved and any of these got worse, how would you feel? What about if A/R went down but you collected less revenue for each visit? How do you feel then?
Look at the entire picture. Focus on working smarter, not harder. Prioritize the work that moves the metric you actually care about. RPV can help you answer questions like whether you should expand the cash side of your practice, which insurers you should stay in-network with, and when is the right time to hire new providers.
Future posts will cover how we break these figures down for our practices and help them improve. But the first step is always just measuring it. Track A/R, and you’ll see marginally more in the bank account every month. Start improving RPV, and you’ll see things start to fly.
If I or my team can be of service, feel free to grab time.
Onwards and upwards,
David